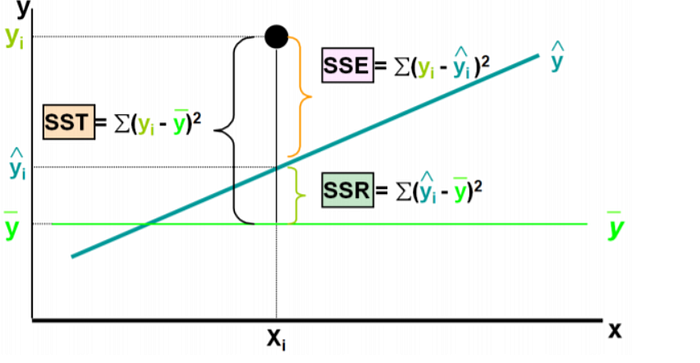
Understanding Sum of Squares: SST, SSR, SSE
In statistics, the concept of “sum of squares” (SS) plays a crucial role in various analyses, particularly in regression analysis. Three key components of sum of squares are Total Sum of Squares (SST), Sum of Squares Regression (SSR), and Sum of Squares Error (SSE). Each of these measures captures different aspects of the variability in data and is essential for evaluating the performance and significance of regression models. Let’s delve deeper into each of these components, explore their definitions, formulas, and establish their relationship.
1. Total Sum of Squares (SST)
Definition: The Total Sum of Squares (SST) quantifies the total variability in the dependent variable (response variable) without considering any explanatory variables (independent variables). It measures how much the observed values of the dependent variable deviate from their mean.
Formula: SST is calculated by summing the squared differences between each observed value of the dependent variable and the overall mean of the dependent variable.

2. Sum of Squares Regression (SSR)
Definition: The Sum of Squares Regression (SSR) quantifies the variability in the dependent variable that is explained by the regression model. It measures how well the regression model fits the data by capturing the deviation of the predicted values from the overall mean of the dependent variable.
Formula: SSR is calculated by summing the squared differences between each predicted value of the dependent variable from the regression model and the overall mean of the dependent variable.

3. Sum of Squares Error (SSE)
Definition: The Sum of Squares Error (SSE) quantifies the variability in the dependent variable that is not explained by the regression model. It measures the discrepancy between the observed values of the dependent variable and the predicted values from the regression model.
Formula: SSE is calculated by summing the squared differences between each observed value of the dependent variable and its corresponding predicted value from the regression model.

Relationship between SST, SSR, and SSE
The relationship between SST, SSR, and SSE can be expressed as follows:

In other words, the total variability in the dependent variable (SST) can be decomposed into two components: the variability explained by the regression model (SSR) and the unexplained variability or error (SSE). This relationship highlights the fundamental principle of regression analysis, where the goal is to minimize the error (SSE) and maximize the explained variability (SSR) to achieve a better fit between the regression model and the observed data.

Clear The Confusion

As mentioned, the sum of squares error (SSE) is also known as the residual sum of squares (RSS), but it’s important to note that SSR is commonly used to denote the sum of squares due to regression. However, there’s no universal standard for the abbreviations of these terms, so it’s essential to follow the standard notation to avoid confusion.
Go through to this article : https://365datascience.com/tutorials/statistics-tutorials/sum-squares/
